
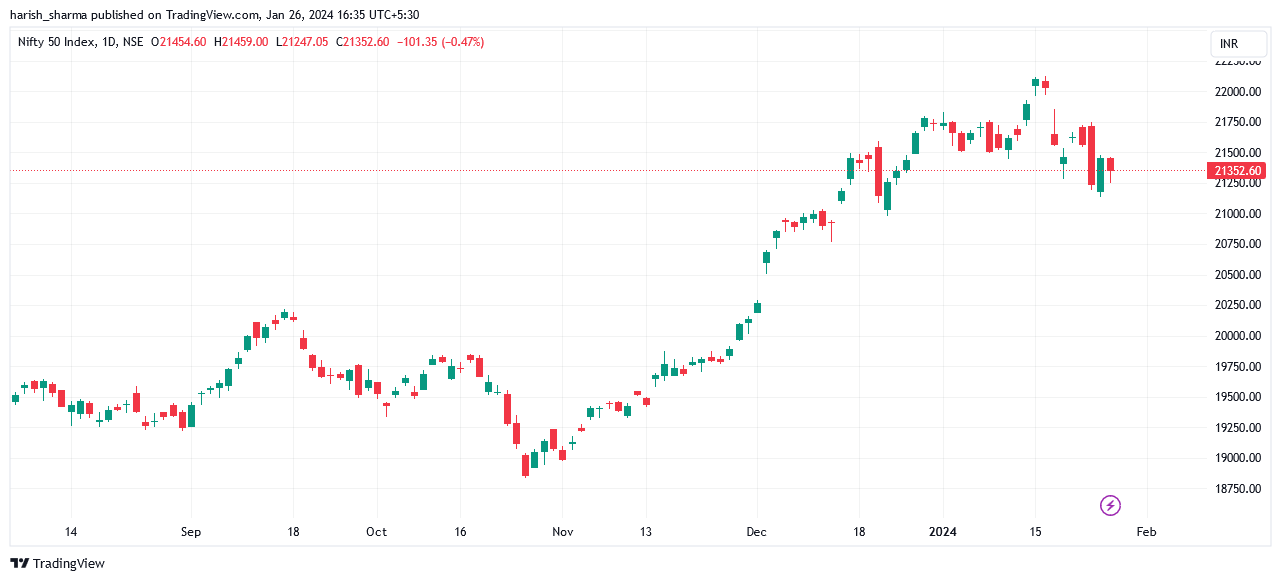
On Thursday Nifty Closed in red, 101.35 points lower than the closing of the previous trading session. In percentage terms, Nifty closed -0.47% lower than the closing of the previous trading session.
Table of Contents
Analysis on 5 minute Chart
During the trading session Nifty made a high of 21459 and a low of 21247.05 and gave adjustment closing at 21352.60. Nifty opened flat and started falling and took support at the level of 21240. Then market retraced back to the level of 21380 and it make a shooting star candle there. After making shooting star candle it fell to the low of initial balance and went sideways for up to 3PM. From 3PM market bounced back till the level of 21400 and then gave adjustment closing at 31352.60.
Top Gainers of NIfty 50
| Symbol | Open | High | Low | Prev. Close | LTP | %chng | Volume |
| BAJAJ-AUTO | 7360 | 7625.15 | 7210 | 7212.85 | 7590 | 5.23 | 2065788 |
| ADANIPORTS | 1122.15 | 1155.75 | 1111.6 | 1120.6 | 1151 | 2.71 | 4586382 |
| NTPC | 310 | 317.2 | 309.2 | 308.85 | 314.75 | 1.91 | 32525422 |
| COALINDIA | 386.8 | 391.7 | 385.35 | 382.6 | 389.8 | 1.88 | 13440949 |
| INDUSINDBK | 1490 | 1543.95 | 1488.6 | 1490.85 | 1508.35 | 1.17 | 9761941 |
| ICICIBANK | 998.4 | 1015.1 | 988.15 | 999.2 | 1009 | 0.98 | 28315035 |
| RELIANCE | 2685.9 | 2728.3 | 2670.4 | 2687.75 | 2711 | 0.87 | 5904436 |
| JSWSTEEL | 815 | 821 | 792.8 | 812.2 | 818.5 | 0.78 | 3240065 |
| GRASIM | 2079.95 | 2087.35 | 2052.15 | 2071.3 | 2087 | 0.76 | 1331279 |
| BAJAJFINSV | 1621.75 | 1635 | 1613.7 | 1620.85 | 1630 | 0.56 | 1744604 |
| BAJFINANCE | 7055.3 | 7125.8 | 7036 | 7055.3 | 7091 | 0.51 | 1168349 |
| HINDALCO | 566.5 | 570 | 558.4 | 565.15 | 567.7 | 0.45 | 5366990 |
| ULTRACEMCO | 9984.6 | 10048.2 | 9881.2 | 9990.5 | 10029.4 | 0.39 | 296269 |
| M&M | 1631.6 | 1642.75 | 1603.9 | 1628.1 | 1633.1 | 0.31 | 2038472 |
| TITAN | 3770.4 | 3796.95 | 3730.1 | 3767.85 | 3770 | 0.06 | 710387 |
| ONGC | 235 | 237.5 | 232.8 | 234.35 | 234.4 | 0.02 | 18291957 |
Top Losers of NIfty 50
| Symbol | Open | High | Low | Prev. Close | LTP | %chng | Volume |
| TECHM | 1348 | 1356.35 | 1312.05 | 1407.95 | 1325 | -5.89 | 8424862 |
| CIPLA | 1413.35 | 1413.45 | 1353.5 | 1417.35 | 1374.8 | -3 | 1801468 |
| BHARTIARTL | 1186 | 1200.65 | 1157.05 | 1189.95 | 1159.75 | -2.54 | 11424697 |
| DIVISLAB | 3644 | 3660 | 3547.25 | 3643.55 | 3555 | -2.43 | 407761 |
| LTIM | 5650 | 5650 | 5457.3 | 5619.55 | 5497 | -2.18 | 911916 |
| TATACONSUM | 1160 | 1163.65 | 1132.35 | 1159 | 1135 | -2.07 | 1125321 |
| HCLTECH | 1570 | 1570 | 1536.75 | 1576.4 | 1549.5 | -1.71 | 2979870 |
| ASIANPAINT | 3010.05 | 3016 | 2942.3 | 2999.45 | 2949.1 | -1.68 | 2068414 |
| SBILIFE | 1414.9 | 1414.9 | 1357.15 | 1410.55 | 1387.5 | -1.63 | 3230297 |
| UPL | 545.75 | 547.6 | 536 | 545.75 | 537.6 | -1.49 | 1723625 |
| ITC | 463.55 | 464.95 | 452.1 | 463.6 | 457.5 | -1.32 | 19677700 |
| NESTLEIND | 2525.05 | 2528 | 2467.7 | 2513.95 | 2481 | -1.31 | 785773 |
| WIPRO | 478.05 | 479.35 | 468.55 | 478.05 | 471.85 | -1.3 | 6776062 |
| DRREDDY | 5902.1 | 5925 | 5822 | 5902.1 | 5832.7 | -1.18 | 535502 |
| SUNPHARMA | 1383.55 | 1390.1 | 1348.5 | 1382.1 | 1366.6 | -1.12 | 2001808 |
| MARUTI | 9988.2 | 9999.8 | 9816.55 | 9988.2 | 9879.75 | -1.09 | 718817 |
| HDFCBANK | 1452.5 | 1457.35 | 1419.4 | 1455.9 | 1440.7 | -1.04 | 49470926 |
| TCS | 3839.9 | 3861 | 3778.7 | 3841.8 | 3807 | -0.91 | 2232178 |
| AXISBANK | 1058 | 1063.7 | 1025.8 | 1059.15 | 1050.1 | -0.85 | 21049587 |
| KOTAKBANK | 1790 | 1797.6 | 1752.4 | 1788.6 | 1775 | -0.76 | 6702170 |
Banknifty made Hammer Candle
Banknifty gave closing in red but on daily chart it made a hammer candle, which is a bullish sign. Banknifty gave closing at 44866.15 which is 216.25 points lower than the closing of the previous trading session. In percentage terms it is 0.48% lower than the closing of the previous trading session. On five minute chart banknifty opened flat and started falling to the level of 44400 and from that level banknifty bounced to the day’s high which is 45140.

Top Gainers of Banknifty
| Symbol | Open | High | Low | Prev. Close | LTP | %chng | Volume |
| PNB | 102.75 | 106 | 100.65 | 102.2 | 105.8 | 3.52 | 111791532 |
| INDUSINDBK | 1490 | 1543.95 | 1488.6 | 1490.85 | 1508.35 | 1.17 | 9761941 |
| IDFCFIRSTB | 80.05 | 80.85 | 78.9 | 79.6 | 80.5 | 1.13 | 80693649 |
| ICICIBANK | 998.4 | 1015.1 | 988.15 | 999.2 | 1009 | 0.98 | 28315035 |
Top Losers of Banknifty
| Symbol | Open | High | Low | Prev. Close | LTP | %chng | Volume |
| FEDERALBNK | 142.6 | 143.5 | 140.55 | 142.2 | 142 | -0.14 | 18228649 |
| SBIN | 618.5 | 623.8 | 606.25 | 618.3 | 615 | -0.53 | 22684904 |
| BANKBARODA | 228 | 231.35 | 223.3 | 228.65 | 227.2 | -0.63 | 36763079 |
| KOTAKBANK | 1790 | 1797.6 | 1752.4 | 1788.6 | 1775 | -0.76 | 6702170 |
| AXISBANK | 1058 | 1063.7 | 1025.8 | 1059.15 | 1050.1 | -0.85 | 21049587 |
| HDFCBANK | 1452.5 | 1457.35 | 1419.4 | 1455.9 | 1440.7 | -1.04 | 49470926 |
| BANDHANBNK | 225 | 226.9 | 219.15 | 224.4 | 221.9 | -1.11 | 16280875 |
| AUBANK | 740 | 741.45 | 703.2 | 737.25 | 710 | -3.7 | 5475393 |